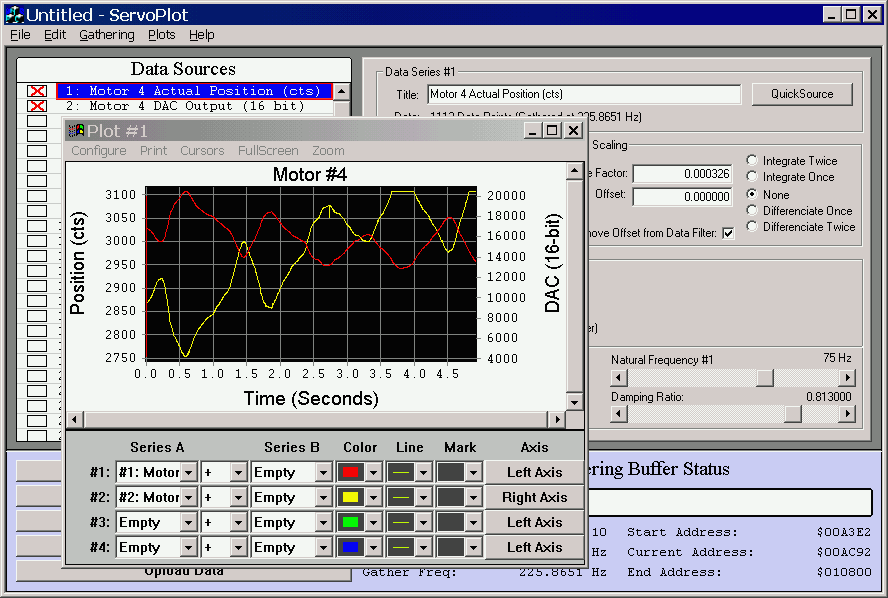
ServoPlot
ServoPlot helps both integrators and end-users utilize Delta-Tau's data gathering features through a simple graphical interface. The graphing capabilities provide the user with a poweful diagnostic tool for debugging problems or monitoring performance. ServoPlot performs three vital functions:
1. Data Gathering and Scaling
2. Data Manipulation
3. Graphing
1. Data Gathering and Scaling

Data gathering is one of the most powerful diagnostic features available on the PMAC controllers. All PMAC controllers can gather data from 24 (or 48 for Turbo PMAC) different sources up to the servo-cycle frequency. Unfortunately this can be a tedious process of setting I variables and transfering data to a graphing program. With ServoPlot these tasks are handled behind the scenes. The user can easily select which data sources he would like to gather and then view the data on an autoscaled graph. Common sources (motor position, DAC output, etc.) can be selected from a list or sources can be by variable type (I,M,P,Q). The user controls the gathering and uploading process with start and stop buttons. Raw data is always uploaded and stored in PMAC's native 24-bit integer format.
ServoPlot supports all data gathering modes. Gathered data can be stored in the user buffer or in DPRAM, and data can be gathered as a one-shot or in wrap-around mode.

Before or after the raw data is uploaded to the PC, it can be scaled into user-friendly units. A simple dialog box allows the user to select how the raw data will be processed.

2. Data Manipulation

After data is gathered from the PMAC, it can be viewed and manipulated in a spreadsheet-like format. The spreadsheet displays both raw and scaled data for each series. Familiar cut/copy/paste/delete operations allow the user to move data between columns and the clipboard. This also allows for exchange of data with other programs.
3. Graphing

The heart of the ServoPlot software is its graphing capabilities. There are four graph types to choose from: Data vs. Time, Data vs. Number, Data vs. Freq., or X vs Y. Regardless of the graph type chosen, the program has the capability to show up to four data series simultaneously (selected from either 24 or 48 series stored in memory). These data series can be plotted on the same axis even if they were gathered at different sample rates.
Advanced plotting features include dynamic panning and zooming, data cursors for precise measurements, and the ability to combine data series on-the-fly.